Showing posts with label Fiscal Policy and Aggregate Demand. Show all posts

Tuesday, September 25, 2018

The Phillips Curve Rides Again

Just when you think the Phillips Curve vanished, it reappears. For those of you who have managed to steer clear of the concept known as the Phillips Curve until now, I would suggest pouring a nice JD over some rocks and watching the grass grow. For those of you who might be even a little curious about this Phillips Curve thing, then read on.

Phillips was one of those New Zealand economists with a lot of initials (A.B.H. aka A.W.H., aka Bill, aka William) before his last name who got famous by noting that there appeared to be a relationship between Ozzie and Harriett – no just kidding – between Ricky and Lucy – just kidding again – between the unemployment rate and wage changes.

This seems innocuous enough, but then real American economists decided to make Phillips even more famous by making the Phillips Curve the truly greatest thing ever in macroeconomics and skateboarding. The first thing they did was replace the wage variable with prices. Thus, they pondered a relationship between the unemployment rate and inflation (the percentage change in prices). I don’t think they got permission from Phillips to make this change but that’s all history now. 

Next they gave the relationship a theoretical foundation. Fancy words – theoretical foundation. The truth is that a monkey with the latest iPhone could have dug up this theory. But sometimes simple things catch on. And they catch on when they support the latest trend in macroeconomics. Recognizing that I am a bit north of my 70th birthday, please understand that when I talk about the latest trends, I am usually referring to the 1960s.

Unlike pink poodle skirts and flat-tops, macroeconomic trends stay around a while. My point today is that the Phillips Curve comes and goes in popularity, but as I was reading the Bible – err I mean the Wall Street Journal – this week it occurred to me that the Phillips Curve had risen from the dead again.

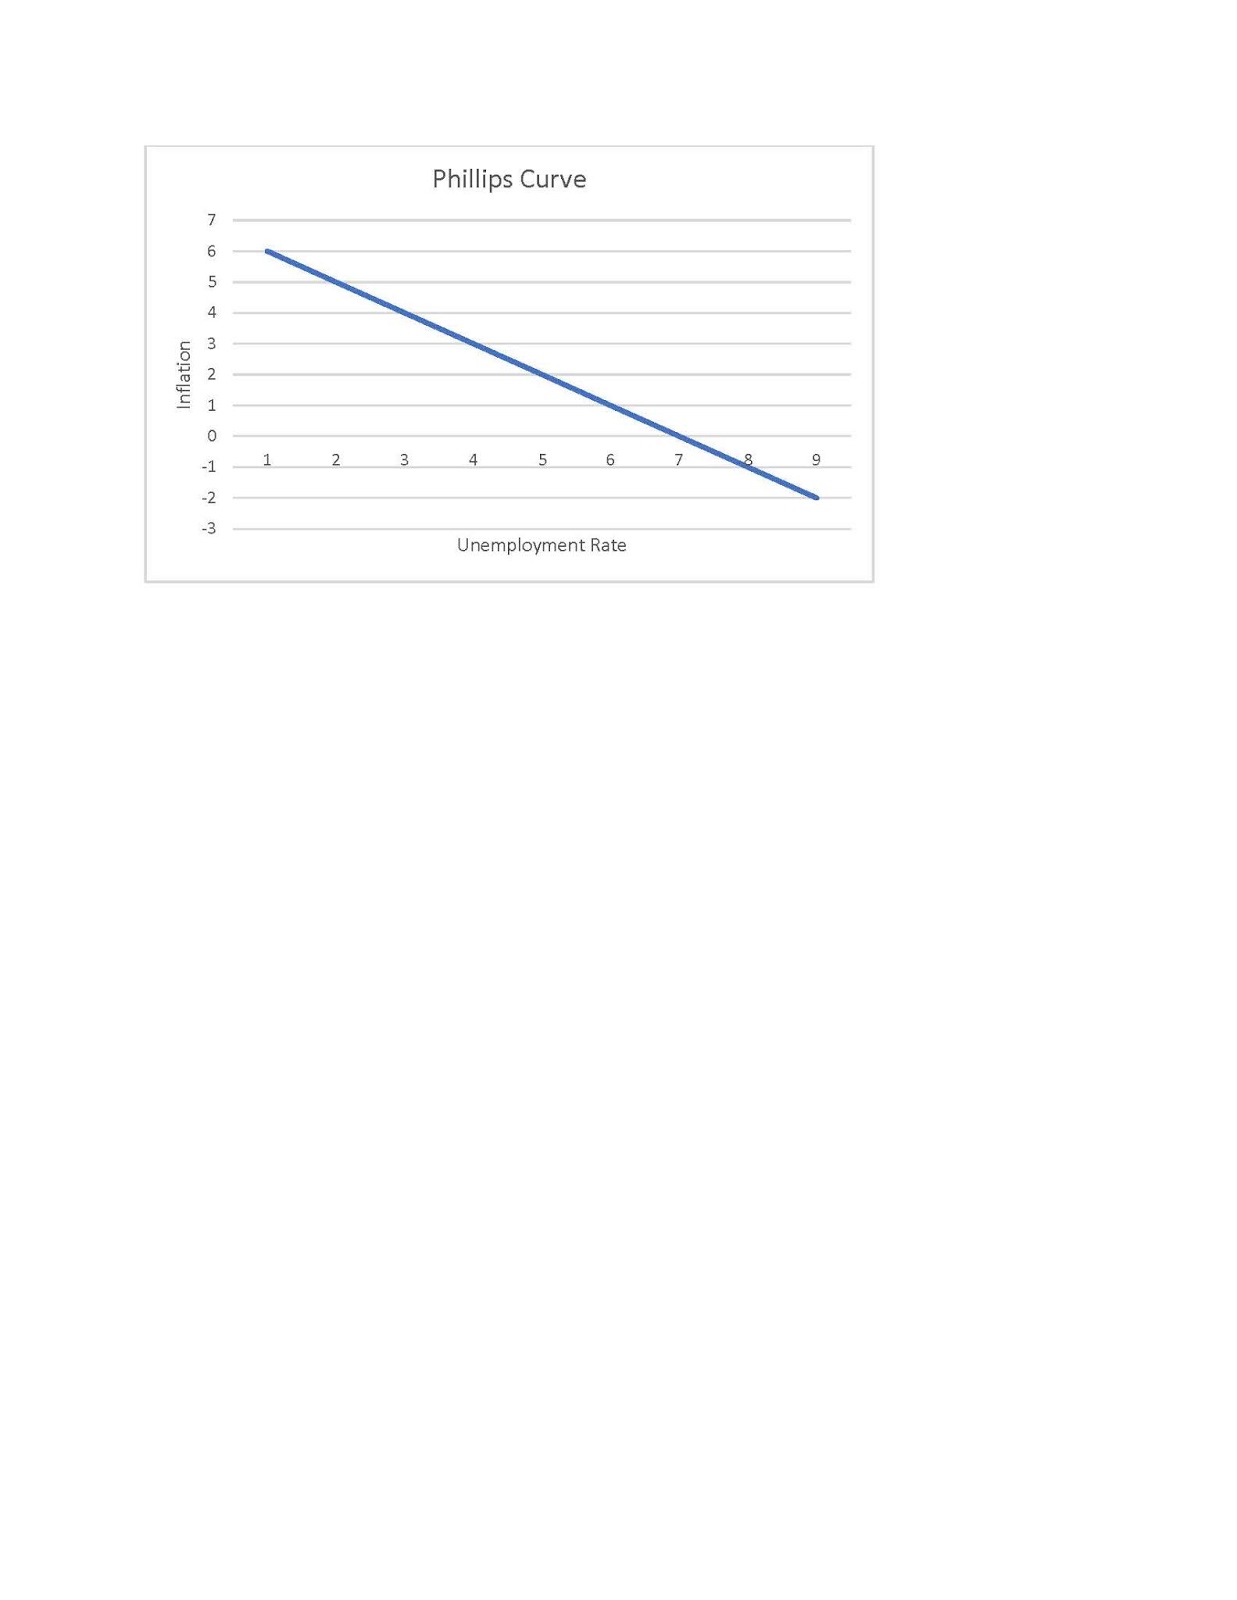
Before I get into those juicy headlines, let’s at least review the basics of the Phillips Curve. Below is a Phillips Curve diagram. The most popular aspect of it is the negative slope that reveals the inverse relationship between inflation and unemployment. Or in more common language, when one of them goes up the other one of them goes down. Sort of like a seesaw.

One might ponder further and say something like, “why?” Why is there a seesaw relationship? The answer comes from short-run macroeconomics and the part of it we call aggregate demand (AD). When households or firms or movie actors decide to buy more stuff, firms get very happy and respond by producing and selling more stuff. To produce more stuff they need more workers and so the unemployment rate goes down. As they hunt for more workers, they raise wages and then they must pass some or all of that wage increase on to their prices. 

Thus when AD increases – unemployment goes down and inflation goes up. Or when AD decreases – unemployment goes up and inflation goes down. Are you seasick from the seesaw yet? That’s basically it. Stay awake Fuzzy.

The big deal is that this little bit of theory is what is behind our love of using monetary and fiscal policy to rev up spending in a flagging economy. Monetary and fiscal policies are designed to pump up AD and therefore save the world from high unemployment – though at a cost of higher inflation.

To get these results, the Phillips Curve is not allowed to move around. It must sit still. Stay Phillips Curve. Stay. Good Phillips Curve. When the Phillips Curve does start to mosey around on the diagram, it messes up the nice seesaw and it ruins the simple world of monetary and fiscal policy. So when the Phillips Curve is jumping to and fro, we forget it exists. But when it sits nicely we take it for a walk.

The last 10 years or so, most economists would rather talk about soccer than Phillips Curves. The unemployment rates around the world went down – but the inflation rate just sat there like a squirrel on Zoloft. That is a sad story for the Phillips Curve. Bad Phillips Curve. 

But all that is changing now. Take Turkey for example. I was going to use Ham instead but we are actually talking about the country, Turkey. The central bank of Turkey recently decided to raise interest rates. And the government got steamed. Why was the government so mad? Because they believe that the rise in interest rates will reduce borrowing for spending and that will cause firms to produce less and fire a lot of workers. Of course, the country would benefit by a slide down the Phillips Curve to lower inflation rates. But the possibility of the higher unemployment rate was too much to risk. Clearly the government of Turkey believes in the Phillips Curve.

Japan is another example of the reincarnation of Phillips. Japan has been bathing in zero or negative inflation for decades. It now seems that inflation is making a comeback – a humble comeback but a comeback nevertheless. So should they be concerned with rising inflation and pull back on stimulus? And risk a rise in the unemployment rate? It's all about Phillips. A decision to curtail inflation will cause higher unemployment if you believe in the stationary seesaw.

It goes without saying that the same discussion is happening in the USA. The Fed has been moving interest rates upward for more than a year now and they plan to keep raising them in 2018 and 2019. A return to normal interest rates, like a return to normal temperatures after sitting in a beer refrigerator for hours, makes sense. But that bit of logic is trampled by the Phillips Curve. The curve was missing in action for 10 years but now all of a sudden it is more popular than a soju in Insadong. Surely if the Fed raises rates a couple more notches, the unemployment rate will rise. Surely if the Fed worries about inflation rising, unemployment will rise.

Okay. Enough about Phillips Curves. Next week I discuss the Davidson Curve. Just kidding again. Who moved my JD?


Tuesday, May 8, 2018

The Tail is Wagging the Dog

Two weeks ago I proclaimed that macro was sleeping and wouldn’t you know it, all the news lately has been about macro policy. Much of the discussion among economists and journalists shows that macro must have one eye open. These policy discussions are as confused as I have ever seen them.

Here are some of the themes. First, the Fed is pretty sure that inflation is going to rise above the cherished 2% target, and they will have to attend to a potential inflation monster with a more aggressive monetary tightening. But then they admit that inflation is not roaring back yet and there is always the worry that a rough policy would lead us into a recession. Second, recent economic growth news from the UK and Germany have us worried that global growth may be in a new tailspin. Just days ago, we were worried that the world might grow too fast. Wham bam – now we are not so sure. Third, we might be headed into a global trade war pitting the US against China, Europe, and several far-off planets. Or maybe not.

Isn’t macro policy fun? It is true that all of us except for John Travolta cannot see the future, and economists always disagree about best policies for any given 7-minute time frame. But today we find ourselves more confused than ever. Why does macro seem so lame these days? What happened to our rocket science?

My explanation begins with the vivid notion that the tail is now wagging the dog. Nolan knows that a dog is supposed to wag its tail and not vice versa. The dog is short-term macroeconomic oscillation. The tail is everything else. It used to be that everything was about the dog. Central banks and treasuries are laser focused on short-term macro stuff. Is the consumer going to be happy this year and buy another car? 

Will tax cuts cause consumers and businesses to spend more? Are firms going to build inventories? Will rising oil prices rob consumers of money they could spend on JD and potato pancakes? In that world, the dog is our focus and we use monetary and fiscal policies to buff up spending when conditions are weak and the opposite when people are spending too much.

But the dog is a mere pussycat today. And the tail is roaring. The tail is the aftermath of the worst world recession that the Tuna can remember. The world economy never entirely exited that recession. We lumber along. Some wonder if capitalism is doomed. Others worry about the lack of enthusiasm firms have for buying new and exciting equipment. Then there is that debt overhang from beer-guzzling college students to pot-smoking boomers with hip pain.

This dragging tail of an economy is also weighed down by a disenchantment of both the young and old for the labor force and the nonchalant attitudes about investment and the resulting lagging productivity gains.

The sad fact is that our dog-oriented policy makers are in the dark when it comes to the tail. They know how to fix the dog and that’s where they focus their attention. If you are a hammer, then every problem is a nail! But dudes, it ain’t the dog. Focusing on the dog means you miss the point. Focusing on the dog means that you are confused by the macroeconomic data. John Maynard Keynes said that we are all dead in the long-run so we should focus on the short-run. But today the tables have turned. We seem to be very alive in the long-run, and the short-run will be a very dull and confusing place if we don’t take care of the future.

Like a 24-hour news cycle, the Fed is always in our thoughts. But the Fed has little to do with the long-run except to provide ample money for long-term growth. All this noise about whether they are going to raise rates 3 or 9 times this year sells soap but is mainly a distraction. Whack-A-Mole economic performance in the US and abroad is similarly uninteresting. The world economy is stuck in neutral, and it has everything to do with longer-term challenges.

We need to put Keynesian economics to bed. It’s hurting our sleep. Let’s require all decision makers at the Fed and in Congress to take a course in long-run macro. But that’s silly. I doubt most of them are smart enough to understand it. And none of our 24 hour news station would find it interesting enough. 

Tuesday, November 28, 2017

Crowding-Out

After three weeks of writing about tax reform, I decided to give us all a little treat and go back to some data. Below is a graph I did with the help of my Uncle FRED -- the data/graphing service of the St. Louis Fed. That's FRED! https://fred.stlouisfed.org/

What I am attempting to do here is to shed a little light on the impacts of government on investment spending. One worry about tax reform today and government growth generally is something called "crowding-out". Crowding-out refers to the idea that the government and the private sector compete to borrow the nation's saving. If the government borrows a dollar from you, that leaves one dollar less for a private company to borrow. This competition for our saving sometimes crowds out or prevents companies from borrowing, or at least raises the cost of debt enough to curtail spending by companies. 

The chart below plots two data series for the last 56 years. The first, in blue, is annual changes in federal government spending in billions of dollars. The second line is changes in real gross private domestic investment. Real GPDI includes both business investment spending (on plant, equipment, and software) and residential investment. This is the red line.

Before I get into some of the numbers, it helps to put this endeavor in context. This exercise is illustrative and seeks to point out a possible negative connection between government spending and private investment spending. This relationship is admittedly complicated and no single factor ever explains changes in investment. So I am going to prove nothing here. One illustration of my challenge is that the times when investment spending falls the most is during recessions. And those are the times when government spending rises the most. A simple logical error would be to mistake correlation for causation. That is, during recessions government spending rises and investment falls, but this is not the result of crowding-out. It is simply the impacts of a recession on investment and government spending. I won't make that mistake here. 

It is interesting to look into history and see when it appears that weak investment spending was the result of crowding-out by government. This is not going to happen all the time. For one thing, government spending has its own cycles wherein it is sometimes rising, sometimes falling, sometimes rising a lot, sometimes rising a little. We would expect evidence of crowding-out only during in those times when government spending is rising rapidly.

Lots of ifs, ands, and buts. But I still think it is worth the effort. (And what else do I have to do?) Conservatives worry that today's impending tax reform is going to cause government deficits and higher government borrowing, and this will lead to crowding-out. Crowding-out is important. Investment spending is the key to future productivity and economic growth. After the 2008-09 recession, investment spending came roaring back, but you can see in the graph that since around 2012, the changes in real GPDI have decreased and went negative in 2016.

So let's look back so we can think about what might be ahead. The chart starts in 1960 and stretches to 2016. Notice the sharp negative impulses in real GPDI. The biggest decreases were during recessions so I won't discuss those further. What is pertinent for my purpose today are the following episodes:
  • After peaking in the mid-1960s, GPDI changes mostly declined through the rest of the decade as government growth was rising.
  • After peaking in the early 1970s, GPDI changes declined for several years as government spending changes rose.
  • In the late 1990s, government spending growth picked up as GPDI spending got smaller.
  • Starting around 2012, government spending increased each year while GPDI spending changes decreased and then turned negative. 
  • Finally, I looked hard at this data and can find no durable experiences when rising changes in government expenditures were accompanied by rising changes in GPDI. 
Sometimes government spending increases get smaller. A notable example is the several years starting from the early 1990s. It means the government got out of the way of firms that were trying to raise money in capital markets. That's what we call crowding-in.
  • Notice that government spending changes decrease from early 1990s for most of that decade and GPDI changes grew rapidly.
So whether you call it crowding-out or crowding-in, I find six examples that provide some evidence of the relationship between changes in government spending and investment spending. When government spending surges, it tends to limit how much investment can be purchased. When government spending increases decline -- something that does not happen very often -- this improves investment spending. 

Quite clearly, if we eliminate contaminated data surrounding the seven recessions from 1970 to 2016, we are removing much from our study. But focusing on those non-recessionary impacted years, we can see quite a few episodes of government crowding-out and crowding-in. 

Government spending soared after the 2001 recession and during the deeper recession of 2008-09. These increases declined for a while but the end of the chart shows government growing again. And current government spending proposals show no end in sight. The chart shows investment spending tanking as crowding-out would imply. 

Can we prove anything with this kind of analysis? I don't think so. But I think there is plenty of ammo in the data to suggest that if we want to see more national investment in housing, plant, equipment, and software, then we might give some consideration to putting a collar on government spending. My analysis did not examine tax cuts or tax reform that create needs for government borrowing. But I will go out on a limb and argue that any such increases in government borrowing because of lower tax revenues and higher government deficits will not be good for national investment either. Wouldn't it be interesting to be talking about government spending slowing and causing crowding-in!


Tuesday, November 21, 2017

The Tax Pizza

Happy Thanksgiving. I hope you are not having pizza for Thanksgiving!

Charlie, Pete, Diane, and Pat wanted to order a pizza. Charlie, of course, wanted tuna on it. Pete, a long-time lover of squid, voted for octopus. Diane favored brussels sprouts while Pat hoped for a nice sprinkling of calf liver. Eventually they compromised and decided to add all those ingredients together. Those of you who have not yet tossed your lunch will get my point. Compromise is not always a good thing. And that’s the way I feel about current tax legislation.

What seems to be missing in all the jockeying and the zillions of words vomited by the media these days is that tax change is done for many reasons. While one should expect that these reasons might conflict as much as liver and squid, it is not unreasonable that we should try to find a compromise. But it is also very possible that compromise will lead to a very bad tasting pizza.

Tax changes can be used for at least the following six reasons:
  1. Taxes might be raised to generate government budget surpluses to reduce the government's outstanding debt. This might also reduce the government’s footprint in financial markets and give more breathing room for firms to attract investors to their assets.
  2. Short-term spending management is part of the Keynesian approach to fine tuning the economy. We give tax breaks to people and firms in a recession so they will spend more. By design these tax changes are temporary and should not have lasting impacts on government debt.
  3. Taxes can be rearranged to create incentives. This need not impact the total amount of revenues collected – only their composition. Reducing taxes (by giving subsidies or deductions) can be useful to promote more work, saving, investment, baby-making, JD production, etc.
  4. Tax changes might be used to affect poverty or the distribution of income. Progressive taxation wherein wealthier people pay higher rates of taxation is part of that effort. But that is just the tip of the iceberg. It is possible to use the tax code to subsidize housing and feed the poor while limiting, say, how much mortgage interest a richer person might deduct.
  5. Taxes can also be used to absorb your time and subsidize the consulting industry. A tax code with many deductions, subsidies, and tax rates means you either spend a ton of time doing your taxes or you hire someone to do them for you.
  6. Taxes can be used to stimulate long-term economic growth. The way to do this usually involves creating incentives for more production. Note – this is VERY different from any of the above goals for tax changes. This one is meant to create an environment in a largely market-oriented economy for businesses to make more money. The idea is that when firms try to make more money they often need to hire more workers and raise their wages. Despite the fact that the immediate impacts of this kind of tax reform are aimed at higher income people and firms, we expect most people to benefit, though not equally.
Okay so that’s six toppings for the tax pizza. So what? If it isn’t already obvious, the main idea here is that we might want to prioritize our goals when it comes to the current tax debate. Putting all six toppings on the tax pizza will likely taste bad. At best, trying to serve six masters dilutes all of them and the end result is a lot of people who are unhappy they didn’t get their fair of the total benefit.

An alternative approach is to prioritize the goals. Of those six goals, which one or two are the very most important for the country today? I tend to harp on economic growth. But I have friends and neighbors who would rather see income distribution as the number one goal of tax change. I say let the political process work that out. While I might disagree with the outcome, at least we might get a policy with a clear intent to improve a difficult problem.

The problem is that our talking heads don’t want to create such a clear set of choices. They survive and profit through obfuscation. They think we are stupid or maybe too busy on our mobile phones to participate. Isn’t it sad that they might be right? Another slice of pizza for you?

Tuesday, November 14, 2017

Trickle Down Tax Policy

Last week I wrote about the Tower of Babel we call tax reform. The main point was the incredible lack of clarity when it comes to changing or reforming taxes. Given all the deductions and other special preferences and the many conflicting goals of tax change, it is very easy to never meet a tax change you ever liked. It is hard to see how legislative progress can be made and even with it, how it might have a discernible positive impact on the country.

But there is even more to the story that I came across in some remarks I read by critics under the rubric of “trickle down”. As an elderly gentleman, I try not to be offended by terms like trickle down, but as an economist I get annoyed when I hear people throwing those terms around. These words are the heart of an argument made by those who are primarily motivated by issues of distribution of income. Trickle down is vivid. A lovely flow of benefits come to the rich folks and by the time they are finished gorging themselves, a couple of drops trickle down to the poor. We could switch the analogy to a lovely and delicious cake consumed by royalty with nothing left but a few crumbs for everyone else. But whether it is a trickle of water or a few nasty crumbs, the point is the same. It is all about how any policy tilts the flow of income or benefits towards the rich. No matter what the intended impacts of the policy might be, all we hear about is trickle trickle trickle.

Common sense allows for the possibility that the true or full impact of a policy could differ from its initial incidence. Let’s suppose a professional team has always done poorly. Its players are paid commensurately. Then the owner decides to bid for a new quarterback. The immediate impact is the apparent unfairness as the new player makes much more money than the others. If the new QB is as good as heralded, the team will win the championship and all the players get bonuses and a big raise. The ultimate impact is what counts despite the apparent unfairness of the initial one. While it is true that these other players still earn considerably less than the handsome, young, sensation with TV contracts and important friends, they are making more than they did before and most would not vote to fire the new player.

Think about one of the many elements of tax reform – significantly reducing the rate of taxation on corporate profits. The immediate impact is easy to envision – a bunch of very rich company owners or stockholders in their condominiums in Vail smoking fine cigars and drinking Spanish brandy. While I cannot deny that owners of corporations will get richer, there is obviously more to the story. Think accounting. I was not a stellar accounting student in Professor Gamoneda’s class at Georgia Tech in 1966, but I do know that if you apply a smaller tax rate to a company’s profits, the company has some additional money to play with. What can that company do with that extra money afforded by the lower tax rate? Here are some examples in no particular order:

            Bribe a government official
            Give it to the owners
            Give it to the employees
            Give a new or improved benefit to employees 
            Add a new wing to the factory
            Buy new production equipment
            Buy new software
            Lower price to get a competitive advantage
            Give more to the local Boys and Girls Club
            Pay off debt faster
            Save it
            Give it to Larry

I am sure I missed something in that list but you get the point. It is tempting, and there might be times when giving most of the extra proceeds to the owners might make sense. But most companies have to compete, and it is pretty clear that they will spend a lot of money to gain an advantage over their adversaries. 

Though this list is long, keep in mind that if your concern is employees, many of those items in the list contain indirect impacts on the incomes of those employees. Any expense – whether it is to better train the employee or it gives that person better equipment to work with – should result in higher productivity. Higher productivity makes it easier for firms to pay them more.

The above can be extrapolated to any element of tax change. There is an immediate and obvious impact followed by less certain and/or less obvious ones. If a tax cut for a higher income person leads to more saving and lower interest rates, that might reduce what a middle income person pays to borrow for a house or a car. Maybe you want to call that trickle down. I just call it economics. To ignore these subsequent but undeniable impacts is folly. 

It is very bad economics to pretend that the only impacts of a tax change make rich people richer and poor people poorer. My advice for those of us who care about the income distribution and poverty is to quit harping on tax reform and spend a few minutes focusing on the real problems that prevent people from leaving poverty status. Or maybe that is too hard to do. If Lyndon Johnson were around and saw the results of his War on Poverty, he might wonder who won the war. 

Tuesday, November 7, 2017

Lesson 20 Taxes (Tower of Babel)

I am sitting at my desk reading all the articles about the latest proposal for tax change in the US. What a mess. Despite it being morning, it makes me want to reach for the extra-large bottle of JD. Have you ever tried JD on Honey Monster Puffs? Wow.

So I scratched my head hoping for some sort of stimulation in brain activity and decided it was time to start at ground zero with a lesson on taxes. Imagine us regular folks trying to decide the best route to Mars. I could begin by wondering about rocket fuel, sun spots, and billboards. And that might lead to discussions with neighbors and perhaps heated arguments, but the truth is that we amateurs might never converge on a realistic answer about the best way to get to Mars. There are so many issues! Better to argue about landscape issues.

So how does any of the above relate to taxes and recent tax proposals? The answer is that while the main idea of a tax is pretty simple, it is the use of taxes that makes the topic so complex. What is a tax? A tax is a way for the government to raise money so it can buy its citizens things. We take for granted that cities, states, and the nation should provide things to their citizens. 

Our Bloomington mayor wanted some shiny, new trash collection trucks so he added a new tax for that purpose. He already gets lots of our money for silly things like fire and police protection but he needed a wee bit more for these pretty new trucks. Each house got equally attractive new garbage cans that come in three sizes so it all made sense and none of us complained.

I think I already got off track. The main idea so far is that governments provide for their citizens, and they need money to do so. So they tax us. Taxes come in all shapes and sizes. In the USA, the main taxes the federal government collects are based on our incomes. State and local governments tend to tax incomes as well as goods we buy. Regardless of the source, these governments use the proceeds to take care of their citizens. That seems pretty simple. If the government wants to spend more, it has to tax more. So why are our friends in Washington, DC, so wild and crazy about the recent tax proposals? Have they been watching too many Steve Martin reruns? 

I can see at least three reasons beyond Steve Martin why the tax proposal generates so much commotion. First, the Federal government is allowed to go in debt. So we have a choice when we want to spend more. We can raise taxes or we can incur more debt or we can have a little more of both. Second, we not only raise most tax revenues based on income but we have a progressive tax system that charges higher rates on higher incomes. Third, the tax system is “holier” than Swiss cheese. No offense to Roger Federer implied. These holes are there for a purpose. Most of us are the recipients of at least one tiny little hole. For example, realtors love it when people can write-off the interest they pay when they borrow to buy their new tiny house. It makes it a lot easier to sell a house when the buyer is being subsidized. The same goes for electric cars and pain pills. Geez, how many of these so-called loopholes or deductions are there? Please don’t count them all up – you have better things to do today.

So what have we learned?  Taxes are pretty simple in principle but in practice they are more complicated than a mission to Mars. It is not simply a matter of government raising taxes so it can buy us shiny new garbage trucks. It becomes a series of questions about how every single person – dare I saw every voter – will react to any given specific way to raise those taxes.
            Tax increase or debt increase?
            Tax high-income people or low-income people?
            Tax young people or old people?
            Tax workers or retired people?
            Tax savers or spenders?
            Tax students or professors?
            Impact housing industry or stockbrokers?
            Tax heirs or new children?
            Tax sexy persons or economists?
            Should I go on?

If you answered yes to the last question, then you need help. If you thought the above stuff was fun, keep reading. It gets even more complicated. We blandly assumed that the tax increase is about raising the resources to spend more. But that is never the whole truth. We use the tax system to cure everything from male impotency to invasive Asian carp.

Think of all the hidden tunnels in our discussions today. Some of us want to use the tax change legislation to reform the tax code so it will create more growth. Others want to use it to address the distribution of income. Still others want to use it for short run stabilization of national spending. While all these goals are laudable, a tax change that improves growth might not immediately improve the distribution of income. A tax program that favors more short-term spending might damage sustainable economic growth. And of course, many of us worry about how these tax changes will affect the price of JD.

I am getting close to my word limit so I better sum up. I can do that with two words – Tower of Babel. Okay, that’s three words. That’s not many words compared to the number you will see and hear in the next days about tax reform. And I bet you this: Few if any of the authors of those words will explain what taxes are and what they should be used to accomplish. Each of these selfish people will take the easy road and will loudly point out how one group is to be favored over another. Having a realistic and thoughtful approach to taxes is beyond them. They would rather achieve star status by fussing about the low hanging fruit. Inasmuch, it is difficult to see any proposal that would have any beneficial impacts passed by the mental institution we call Congress. No one wants to be a loser, and no one will admit what goals they hope to accomplish. 

Even if a proposal is passed into law, we will accomplish no national goals, and we will end up pointing more fingers at each other after the tax change than we did before it. 

Tuesday, September 26, 2017

Happy Birthday to the National Debt

Let’s call her Natty. Natty just reached 20 -- $20 trillion that is. Okay, it’s not a birthday but it is a milestone and one that bears a little time and attention.

There are so many things to say that I don’t know where to begin.

Let’s think first about the words “national debt.” Natty is most definitely not a measure of all the debt of the nation. Households have many kinds of debt and none of them are included in the $20 trillion national debt. Borrowing money for houses, cars, JD, and college are not part of Natty. All that credit created by slipping your credit card into a little machine is not included in Natty. That loan to Uncle Chuck isn’t part of it either. And when companies large and small borrow from banks or sell bonds or find other means to finance their acquisitions of plant, equipment, and software – none of that is included either.

So what is included in Natty? Natty is simply the debt owed by the federal government. Notice that Natty does not include any borrowings of your state and local governments. Natty’s $20 trillion pile of debt includes only that which the US federal government borrowed.

Why does the government owe any money? Doesn’t the government have the power to tax us? Surely there are plenty of federal taxes. The truth is that the government owes money because, like the Tuna, it loves to spend money and hates to ask us taxpayers to pay the whole deal. Take 2016 for example. The government collected $3.3 trillion in tax revenue. On Social Security, Medicare, defense, and many other programs, it spent approximately $3.9 trillion. Thus the government had to borrow $585 billion to meet the difference.

Why did the government have to borrow that money? Doesn’t the government have the power to print money without limit? In most countries, including the USA, a central bank exists and it is allowed to print money. But budget deficits must be funded by government borrowing through bonds. Clever governments ask central banks to buy their debt and that eases the process. But as we will see below, most of the debt is held by private investors.

In 2016 the government borrowed $585 billion. That’s a long way from $20 trillion. How did the debt get so large? The answer is that the US government is addicted to debt. In the 49 years between 1967 and 2016, the US had a surplus only five times. Thus we had deficits and we added to the debt in 44 of those 49 years. That’s how the debt got so large. We piled up almost $8 trillion of the $20 trillion in the nine years since the great recession started in 2008. While the additions to the debt have been somewhat less lately, we had at least three years in which the annual deficits were well over $1 trillion per year.

Who holds the national debt? I heard China has a lot of it. Let’s start with the 2016 national debt of $19.6 trillion. Of that amount, $5.4 trillion was money that some parts of government owed to other parts of government. So we call the public debt the remaining $14.2 trillion. Of that amount, the Federal Reserve owned $2.8 trillion. That left $11.7 trillion for private investors. Of that amount, Chinese and other foreigners owned $6.2 trillion. 

Is that $6.2 trillion enough for foreigners to push the US around? I doubt it. But in the event that foreigners decided to quickly sell all their US bonds, that could throw us for a loop. But keep this in mind, if any investors in US bonds decided they are a risky bet – it doesn’t matter whether the sales come from foreigners or US citizens – the results could be terrible.

This leads us to the big question: Does the $20 trillion debt put the US in a risky position? The government is a pretty big cat; is $20 trillion a lot of money? Here is where an example might be helpful. Suppose you have debt of $100,000. Is that risky? It depends on your ability to pay it off. Maybe you have a savings account of $3 million. Not so bad. Maybe you have an annual income of $300,000. Not so bad. But if instead you have no money in the bank and you have a very low income, then your bank is going to worry about your ability to repay the $100,000.

Similar ideas apply to countries. How do you measure the ability of a country to repay its debt? We might look at foreign reserves they accumulated to pay foreigners. We might also look at tax revenues. Those tax revenues are driven by the strength of the economy and the soundness of the financial system. If a country is about to implode, it worries a lot of people – including people who hold that government’s bonds.

Is $20 trillion too much debt for the USA? Probably not at the moment. But psychology moves quickly. If we seem unable to restrain our future debts because we spend too much and tax too little that will not make bondholders happy. If our economy grows too slowly or if a recession threatens even worse economic outcomes, that realization will make things scarey. At that point the $20 trillion will seem like a very risky burden.

Ask other countries about how quickly a difficult situation can turn into a crisis. One day you are the darling of the world. The next day people are selling your assets and your currency and you are the basket-case of the world.

We manage debt to be prudent. A modest debt load is normal. A larger amount of debt won’t necessarily undo you but it does raise the risk of some very bad things happening. It is time our US government acted as if they knew this valuable truth.


Tuesday, September 19, 2017

Lesson 19 Tax Reform and Simultaneous Organization

Who is up next? I am. My name is Tax Reform. My friend healthcare already struck out. Budget, debt limit, and immigration will be up in future innings or maybe in future games. I don’t know.

No, government policy is not a baseball game. But it sure seems like one as policy deliberations and decisions flow sequentially from one month (inning) to the next. 

What other choice is there? While it seems almost crazy to mention, a better choice is to do it all at once – simultaneous instead of sequential.

We seem to be focused now on tax reform. But we are already hearing that you can’t do tax reform until you settle healthcare. Or you can’t get much accomplished with tax reform until you settle the budget or change the debt ceiling. It’s all related. Who came first, the chicken or the egg?

There must be a prize in government that is awarded to the people who make simple things impossible. People make budgets all the time. So do companies and churches and drug dealers. We plan and make budgets because this activity produces better results. Instead we could wake each morning and make a new decision. It’s Tuesday so maybe I will buy a TV. It is Wednesday so I might sell some shares of stock. It is Thursday, and I will get a job and earn some money.

Sound stupid? It should. But this is the way government works each year. The main reason that sequential budgeting does not work in government is that each policy affects many aspects of our lives. A given policy helps Nolan while is hurts Jenny. Of course, Jenny and her friends scream bloody murder. The next policy helps Jenny but not Nolan. Nolan organizes his kindergarten buddies, and they throw rotten eggs at guilty politicians. The upshot is that sequential decision making gets nowhere because EACH decision has a natural resistance.

Better would be a more simultaneous approach. Let’s take five different areas of policy and find the best solutions. Policy 1 helps one group. Policy 2 helps another group. Policy 3 might help both groups. If you decide and then announce all five policies at once, it is harder for resistance to form. For one thing, figuring out the net effects on people might not be easy when summing up all the pluses and minuses of all the policies. For another, it might be the truth that most of us benefit from the whole package, warts and all.

The above is too abstract. Think next how this might play out in the real world. Good planners begin with a statement of problems. Once the problems are known they can then think about the remedies. What are our national problems?

Low labor participation
Low capital spending 
Slow economic growth
Unequal distribution of income
High government debt
Inefficient tax system
Too little/too much government spending
Too much/too little government regulation of business
Healthcare
Pimples, JD, and other

We can argue about these problems and their order of importance but it seems possible that a fruitful beginning step by national policymakers would be to list these problems according to some definition of priority or importance. Ties are permissible. Just rank them, damn it.

Then they would produce a list of policies that might address one or more of those problems. Such policies would include tax reform, tax cuts, government spending changes, reforms to healthcare, immigration policies, and so on.

Assign every policy a positive or negative number as to how that policy might impact each and every problem listed. Note that a tax reform policy might help the rich more than the poor in dollar terms. A government spending policy might do the opposite. Do not try to make every policy help every problem and every person. Each policy should have an intended benefit though with side effects.

Summarize the positive and negative impacts of each policy on each problem area. The first round of this simultaneous approach will find some policymakers do not approve of the results. Go back at it and adjust each policy so that the net result of all the policies is acceptable. No set of policies will make everyone happy. This approach has a chance of finding a solution that recognizes that not every policy will make everyone happy but that the sum of all the policies generally improves things.

Every major organization works this way. The board approves a comprehensive plan whose purpose is to best meet the goals of the organization – be they marketing, finance, or human resources. They do not go from day-to-day making decisions willy-nilly. Call me a dreamer for believing that government can be thoughtful and goal focused. But that just shows how we have come to accept idiotic and failed approaches to our very important problems and goals. Or maybe, like watching a good fist fight, we revel in the blood and guts. Government policy is pure entertainment. In that case, we deserve what we get. 

Friday, August 25, 2017

Tax Loopholes and Tax Reform

Not sure they will get around to tax reform this year, but I am told that tax reform is high on the legislative agenda. Tax reform usually involves significant changes in income and/or business tax rates. For example, we hear talk that US corporations pay tax rates that are very high. A tax reform might, therefore, reduce the rate to something lower. Tax reform might instead lower tax rates for the middle class or for rich people. There are many ways to do tax reform.

As a result of the lower tax rates of a tax reform, tax revenues would likely fall. So an important part of any tax reform that lowers tax rates but does not want to create larger government deficits is the accompanying ways to raise tax revenue. One approach would create a totally new tax. Some thought was given to the USA adopting a value added tax or perhaps an import tax. More likely, however, is the closing of existing tax loopholes. That approach sounds much better to most of us. But as I will show below, it is not so easy and the attempt to close loopholes may actually doom tax reform.

First, our friend Wikipedia says a loophole is an ambiguity or inadequacy of a system, such as a law or security, which can be used to circumvent or otherwise avoid the purpose, implied or explicitly stated, of the system. That makes a loophole sound pretty bad. It should be easy to eliminate tax avoidance. But a further look at tax loopholes suggests that many of the biggest ones are there for specific reasons.

We sometimes use the word tax expenditure for myriad reasons that allow people to avoid paying tax. Tax expenditures are defined as special provisions of the tax law such as exclusions, deductions, deferrals, credits, and tax rates that benefit specific activities or groups of taxpayers. Tax expenditure? Tax loophole? Pretty much the same thing. But the wording is kinder. Why? Because it implies that it isn’t an error or a deficiency in the system. Rather, it is an intent to promote an end. Getting rid of a loophole sounds easy. But a tax expenditure has a purpose. Do we really want to end it? If so, who gets hurt?

Below I list only some of the major tax expenditures and the amounts (in billions of dollars) estimated by the Tax Policy Center for 2018 (http://www.taxpolicycenter.org/briefing-book/what-are-largest-tax-expenditures)
Exclusion of employer contribution for medical care premiums
  and medical care $235.8
Exclusion of net imputed rental income $112.7
Deferral of income from controlled foreign corporations $112.6
Capital gains $108.6
Defined benefit and defined contribution employer health plans $140.4
Mortgage interest expense on owner-occupied homes $68.1
Earned income tax credit $63.6
Deductibility of state taxes $63.3
Child credit $54.3
Charitable giving $51.2

There are plenty more but this list adds up to just short of a trillion dollars. Thus we learn two points. First, that’s a healthy amount of money if we are looking for loopholes to close. Second, who is going to resist closing each one of these? People who want cheaper healthcare? People who receive rental income and capital gains? State and local governments? Poor people and those who represent poor people? Parents? Homeowners?

Other federal government tax loopholes?
            American Opportunity Tax Credit to reduce the cost of education
            Savers Tax Credit helps low income people save for retirement
            Lifetime Learning Credit to reduce cost of education
            Retirement Saving Accounts
            Carried Interest Loophole for mostly high income taxpayers
  529 College Saving Plan for parents saving for child’s education
                      
Finally comes the fun part. There are so many loopholes in our tax system that you would have difficulty listing them all. Investopedia (http://www.investopedia.com/financial-edge/0512/americas-most-outrageous-tax-loopholes.aspx) found some interesting ones that relate to state and local taxes:
            The Florida Rent-A-Cow Credit
            Washington DIY Cigarette Discount
            The Arkansas Credit for Naturally Destroyed Autos
            The Accelerated Depreciation of NASCAR Tracks
            Larry’s JD exemption (just kidding)

Even with these last few loopholes, there were reasons for instituting them. Closing tax loopholes is not a slam dunk. Tax reform and reducing our tax rates is valuable for many reasons. But if tax reform is not going to blow a hole in our national deficit and debt, then some of these tax loopholes have to go. Which ones will you vote for? 

Tuesday, July 18, 2017

Sustainable Medicaid spending

Since the government is working on several different versions of a healthcare bill for the USA, it is not easy to know what will be legislated and how those changes will affect us. What we can know is that some folks will claim the sky will fall, and maybe it will. But since the sky has never fallen in my lifetime, I thought I would look backward in this post. This continues my wail about government addiction to debt. Lost in the preoccupation with the future is what happened to government spending and debt in the recent past. We don't really hate poor people. But we do have to think harder about how we accumulate debt. So here goes.

I got a little wild and crazy with the data. It makes me want to gulp JD and sing Blue Suede Shoes (Carl Perkins version). At the bottom of this post is one huge table with three parts.
     Part 1: Amounts for various categories of government budgeting in billions of dollars for the years 2006, 2011, 2016, 2021, and 2026. The data for 2021 and 2026 were given to me by Putin. Just kidding. They are estimates of the future based on past legislation. That is, if we do not change any legislation, that is what the Congressional Budget Office thinks will happen to spending in the future.
     Part 2: The changes, in billions of dollars, between those five-year time periods.
     Part 3: The percent changes between those time periods. The last two lines 06-16 and 16-26 summarize a comparison of 10 years past to 10 years in the future.

Let's start with the last column which shows federal government revenues. The government collected around $2.4 trillion in 2006. By 2016, it was raking in $3.3 trillion, an increase of about 36%. That seems reasonable. With no legislative changes, this would increase to almost $5 trillion in 2026 or 51% higher than in 2016.

I started with revenues because they are a benchmark for how much spending could grow without increasing the government debt. A 51% increase in the next 10 years seems reasonable. But then, if you are paying that 51% increase, you might want to argue about that. One thing we learn is that the rate of growth of federal taxes will be much higher (the rise from 36% to 51% is a 42% increase) in the future compared to the past. Don't say a word to me about austerity!

With that benchmark, we can now look at spending. Let's start with Medicaid.  Medicaid was a mere $181 billion in 2006, rising to $369 billion in 2016. So in the past 10 years, Medicaid spending rose by 104%. Review: Taxes rose by 36%; Medicaid by 104%. Medicaid will rise another 78% from 2016 to 2026. So whether we look backward or forward, Medicaid is one of the stars of government spending -- rising much faster than overall revenues.

If we want to be concerned about deficient government spending, look at the Income Security (Part of Mandatory Spending) and Discretionary changes. These components contain a lot of government programs*. After rising by 52% in the past 10 years, Income Security is projected to grow by only 21% in the next 10. Discretionary spending rose by 17% in the past and could rise by 24% in the future. Laggards!

Not to be prejudiced against Social Security and Medicare, you can see that those programs are doing their respective parts to bankrupt our country. After growing by 67%, SS will grow another 84%; Medicare will leap by 101% after growing by 84% previously.

The sad conclusion is this: As a centrist I support using the government to help people. But as a centrist, I also believe the best way to help people in a sustainable way is to not go bankrupt. These numbers help us see that we are on our way to trouble. These numbers do not incorporate any proposed increases in spending on military and infrastructure and do not incorporate any budgetary changes attendant to reforming healthcare or taxes.

These numbers suggest that Medicaid is among several key spending areas that must be addressed. It is not our national purpose to harm or kill the old and sick. But it is in our national interest to find ways to correct a problem in such a way that we can sustain programs that help the elderly, the sick and others. If ideologues scream murderer every time a program's growth is slowed -- then we will have to deal with a world in which none of the government works.

*Discretionary Spending includes spending on such items as education, scientific research, infrastructure, parks, environmental protection, some low-income assistance, public health and more.  

Table 

Social  Income  Discre- Rev-
Billions  Security Medicare Medicaid Security tionary enues
2006 544 377 181 2001017 2407
2011 725 560 275 404 1347 2303
2016 910 692 368 304 1185 3268
2021 1184 904 479 320 1306 4011
2026 1674 1390 655 369 1464 4948
Social  Income  Discre- Rev-
Change Security Medicare Medicaid Security tionary enues
6 to 11 181 183 94 204 330 -104
11 to 16 185 133 93 -100 -162 965
16 to 21 274 212 111 16 121 743
21 to 26 490 486 176 49 158 937
Percent Social  Income  Discre- Rev-
Change Security Medicare Medicaid Security tionary enues
6 to 11 33 49 52 102 32 -4
11 to 16 26 24 34 -25 -12 42
16 to 21 30 31 30 5 10 23
21 to 26 41 54 37 15 12 23
 6 to 16 67 84 104 52 17 36
16 to 26 84 101 78 21 24 51

Tuesday, July 11, 2017

US Leading in Government Deficits

Two weeks ago, I wrote a post about US national debt and deficits and concluded that past governments have put our country in a very tough place with few good options that could restore economic growth. Some friends wondered whether the US is alone is this distinction. So I found some IMF data to compare the US against other key countries.

The first line in the table below gives you US information. After averaging annual government deficits of 3.5% of GDP from 1999 to 2008, the deficit is now 4% in 2017. Thus the deficit is now worse. We had deficits in all 7 years since 2011 with the highest deficit in 2011 of 9.6%.

In all these categories, the US was worse than the EU and the other comparison countries. While all these countries are habitual debtors, Canada was slightly better since it had a surplus in one of those seven years. Germany had only two deficits in those seven years. Wunderbar!

When it comes to 2017, the US and Japan were tied with deficits of about 4% of GDP. Germany posted a surplus in that year of 0.6% of GDP. The UK, Canada, Italy, and the EU had deficits that were smaller (better) than 3% of GDP. The difference between 3% and 4% might seem small but remember we are taking these numbers as a percentage of GDP, which is $15 trillion in the USA. Also keep in mind that four is 33% higher (worse) than three. I next looked at a table with similar data for emerging markets and found that even this comparison is not good for the US. China, Russia, Mexico, Turkey and Romania among many others all had smaller (better) deficits than the US in 2017. Of course the US beat Brazil and Venezuela, Pakistan, and India. Way to go team!

The US stood out from the pack in having recorded the highest one-year budget deficit between 2011 and 2017. Japan came close with 9.1% and the UK's was 7.7%. The rest were virtually half or less than half of the US budget deficit.

Conclusion: the US tends to have larger deficits than other comparable world leaders -- both before the recession and after. We not only have larger persistent deficits but we also juice them higher when faced with a major recession. Apparently government deficits are our drug of choice.

I then found another table that compared the US to 39 other advanced nations. In 2017, there was not one single country with a budget deficit larger than the US deficit of 4% of GDP. There were 10 countries in 2017 that had surpluses: the Netherlands, Luxembourg, Latvia, South Korea, Macao, Iceland, Singapore, Hong Kong, Norway, and New Zealand. These countries typically have budget surpluses.

The US has a deficit problem whether we compare the numbers in dollars, in percent of GDP, in one year or over many. It is clear from looking at 40 major industrial countries that such behavior is neither typical nor desirable. We are hooked on the government spending drug. I think we need an AA meeting.

Budget Data for Selected Countries and Regions
Source: International Monetary Fund, World Economic Outlook, April 2017, Table A8.
Key:
2017: Budget position in 2017. Minus indicates deficit.
Fiscal Year 2017 ends September 30, 2017
99 to 08: the average budget position from 1999 to 2008
Change: Change from that average to 2017
# Defs 11 to17: How many deficits from 2011 to 2017
Highest 11 to 17: Highest annual deficit from 2011 to 2017
2017 99 to 08 Change # Defs Highest
11 to 17 11 to 17
US -4.0 -3.5 Worse 7 -9.6
EU -1.5 -2.0 Better 7 -4.2
Germany  0.6 -2.1 Better 2 -1.0
France -3.2 -2.6 Worse 7 -5.1
Italy -2.4 -2.9 Better 7 -3.7
Japan -4.0 -5.5 Better 7 -9.1
UK -2.8   -1.9 Worse 7 -7.7
Canada -2.4  1.1 Worse 6 -3.3

Tuesday, June 20, 2017

Inflation and Rocky: Down But Not Out

The table below explains why people are saying, what’s up with inflation? In the decade including 2007 to 2016, the US inflation rate averaged 1.9% per year. If we compare that to any of the full decades from 1950 to 2010, that 1.9% is lower than any of the 10-year averages. The lowest annual inflation rate for a decade was the 2.3% of the 1950s. The 1.9% is also lower than the average annual rate of about 4.7% per year from 1950 to 2010.

What happened to inflation? Why is it so low? Are we in a new zone wherein low inflation is guaranteed for the foreseeable future? Or is it like Rocky and will bounce off the canvas once he clears his head?

Since only the Tuna knows the future for sure, I can’t really answer those questions. But a good place to start is with an understanding of tires and pumps. No just kidding. A good place to start is with some basic macro. And basic macro says Rocky might be wobbling right now but don’t count him down and out.

Inflation is the percentage change in prices for a nation. We use words like “basket of goods and services” to evoke the idea that inflation is not about the price of pickles or goat cheese. "Basket of goods and services" makes one think of all the goods and services the people of a country might typically buy. Inflation refers to how the cost of that basket of goods and services changes over time. If it cost $100 dollars one year and then rose to $105 the next year, we would call that a national inflation rate of 5%. If that same basket of goods and services fell to $104 in the next year, we would call that a deflation rate of about -1%.

You can see why people might worry about inflation. If your wages did not rise but the inflation rate was 5%, then you would feel poorer because your income would buy fewer goods and services. Ouch. The same goes for all your saving. If you have $1000 in the bank, it too will buy less because the cost of things went up. Double ouch.

That brings me to my first point. How could inflation rise by more than your wages? It doesn’t make much sense that it could go on very long. Sure, greedy businesses might want to raise their prices but if wages don’t rise and people can’t buy as much, then surely the price increases won’t stick for very long.

But look at the table. Inflation has kicked up many times and for as long as a decade or more. How is that possible? The first answer is government. The second is expectations.

Consider how government figures into this. Suppose firms raise prices but not wages. Consumers can't buy as much as before. The economy begins to slow. Governments don’t like recessions, so as the economy slows, the government decides to stimulate spending. Government stimulation thereby replaces the reduction in private spending with an increase. With spending restored, inflation sticks.

So firms raise prices again. What fun! Inflation is on a roll. Meanwhile workers are saying, what’s up? Dudes, you keep raising prices but not wages and we keep getting poorer. Cagey firms might then give in to wage demands. Notice that higher wages mean that workers can buy more and this keeps the inflation party going. But the trick for firms is to NOT raise wages enough to seriously damage their profits.  

For a while (much of the 1960s and part of the 1970s), workers got wage increases but they never quite caught up. And then viola!, workers figured it out and demanded a proper wage increase. In 1979, coal miners asked for a 39% wage increase for their coming three-year contract. Other workers followed. That was like taking a 2x4 to company profits and caused a couple of recessions in the beginning of the 1980s. Once workers expected higher inflation they wanted higher wages. This is the second impetus to higher inflation as firms pass along those new costs into even higher prices for goods and services. 

Those recessions created the incentive for the government to jump in again. Except by 1980 the government had accumulated an ugly national debt and wasn’t prepared to bail out the firms. No bailout? Without the bailout and with a weak economy, firms were much less apt to try to raise prices. The table shows the inflation rate moving in a better direction after 1980. With government stimulus and inflationary expectations falling, it made sense that actual inflation would decrease.

One more point that may seem to fly in the face of all the above. Milton Friedman coined the phrase "money, that's what I want". No wait, that was the Beatles. Forget that.  Friedman said, “inflation is always and everywhere a monetary phenomenon.” Milton Friedman was not simplifying when he said the above. So we have to add a bit to our story to bring in money.

According to Friedman and other monetarists, a government is limited in how much it can stimulate spending. In the above storytelling, I glibly spoke the company line that a government deficit could be used to stimulate spending. But that idea exaggerates their powers. Government deficit spending is less powerful if people believe that a deficit will be temporary. The more people think that the government will soon either retract spending or raise taxes, the more they adjust their spending (downward) to that expected reality.

So it is not the government deficit itself that permits spending and inflation to increase. It is the act of the Central Bank monetizing the government debt that seals the deal. Government deficits cause interest rates to rise. The Central Bank reacts to those rising rates by flooding the economy with money. And that money is the magic grease to keep the spending and inflation going. The money is not the cherry on the top – the money is the ice cream, the cherry, the bowl, and the JD.

That brings us to today. Workers are too worried about a weak economy to push for higher wages. The government has no more bullets and can’t increase spending. Thus, inflation is at bay. But that’s not the whole story. The rest of the story is the money that is sitting in bank excess reserve accounts. So long as the money sits in those accounts, we are at risk of them turning into real loans and real spending power. It won’t take a huge change to get all that green moving. The Fed is scared to death to drain those reserves from the system. They are ready to be spent. The unemployment rate is down and labor markets are tightening worldwide. Thus workers will soon feel their oats and will be ready to jump on higher wages.

It won’t take a forest fire to get things started. Little bits of information flow that make us more optimistic about the future. That growing optimism combined with a forest full of money can suddenly spark a spending spree. And that could ignite inflation expectations and lead to workers demanding higher wages. None of that could happen without all that money sitting around. With government stimulus stuck in neutral, a stronger economy can't cause a sustainable rise in inflation. With government stimulus unchanged, inflationary expectations can't unleash a wave of higher wages. It's the money that is the risk today. With trillions of dollars in excess reserves, spending can expand elastically, wages can grow without limit, and inflation will rear its ugly head. To Janet Yellen: Get rid of that money before it comes back to bite us all. Let's keep Rocky on the mat. 


Inflation Rate of the
Consumer Price Index
By Decade (In Annual % Change)

1950s                           2.3
1960s                           3.1
1970s                         11.2
1980s                           5.9
1990s                           3.2
2000s                           2.7

2007 to 2016               1.9