In a previous post -- Inflation or Deflation Part 1 -- I focused on how to read an inflation press release. Now let’s talk more about the issues. Below I try to persuade you that deflation is not a high probability event and reflation might not be as far away as some people think.
If we are going to forecast something, then we need to check it out first. When faced with a choice for an appetizer, will Mikey choose the piled-high gooey nachos or the patiently arranged raw carrots and celery? Not knowing too much about Mikey, it would be good to have an experiment where we watched Mikey 100 or more times and see what he chose. In that spirit let’s see what we know about changes in the CPI rate of inflation. The graph at the St. Louis Fed (http://research.stlouisfed.org/publications/net/page8.pdf ) might be instructive. The CPI graph plots yoy (year-over-year) inflation rates from 1984 to present. You see the inflation rate going above 6% in 1990 and then following a disinflation trend through about 1998 when the inflation rate fell below 2%. Since then you see a reversal of trend – despite some up and down behavior, the general trend shows the inflation rate generally rising from 1998 to 2008 where it almost reached the 6% mark in mid-2008.
Recent behavior, therefore, shows that inflation has the capacity to both fluctuate and to move in general trends for significant time periods. The latest trend was reflation – and the big question is where we are headed from today in 2010. After peaking in mid 2008, we see the only yoy episode of deflation happening in mid 2009—followed by a return to over 2% in 2010. As of May 2010, the yoy rate is about 2%.
With that background, what can you say? What will the data show in the next half year through December 2010? Will we return to reflation similar to 1998 through 2008? Or will we disinflate like we did from 1990 to 1998?
To answer these questions, this one chart isn’t going to be enough. We need to supplement it with data and explanations about cause and effect. This sounds pretty cool to me – but the TRUTH is that inflation is like other economic indicators – it is complicated and the cause/effect factors change over time. What I am saying is that I am not going to be proving anything here. You won’t see any equations or null hypotheses here. This is more like a Rorschach Test – what you see in the picture may be determined more by your own potting training than by my artistic abilities. In this case I am acting as much like a lawyer (shudder) as an economist. A lawyer does not have to prove that his client is innocent – he simply has to use facts and arguments to convince the judge or jury that his client did not, in fact, steal that plane and fly it to a remote Caribbean Island. Dear judge – let me try to convince you about the future course of inflation.
Economists use theory (some people would call this gobbligook) to try to understand inflation. Since this theory topic could be a whole chapter in a long dreary textbook, please excuse me for simplifying. CPI inflation theory is about the causes of changes of the prices of goods and services we consume each month. In a market system, we think that the prices of most goods and services are driven by supply and demand. When demand is rising faster than supply of goods and services, we predict reflation. When supply is increasing faster than demand, then we predict disinflation. If the difference is big enough, this could cause deflation.
Here is a partial but extremely exciting list of things that might cause demand to be rising faster than supply and therefore predict reflation in the near future. Let’s divide the list into demand stuff and supply stuff.
First the demand stuff:
o Fast money growth causes households and firms to want to spend more
o Rising government deficits cause governments, households and firms to buy more
o Rising net wealth cause households to feel wealthier – they spend more
o Firms have been expanding output causing incomes of workers to increase and they spend more
o Consumer confidence is rising causing households and firms to buy more
o The value of the dollar is falling or the incomes of trading partners is rising causing net exports to increase
o Other stuff
Now the supply stuff
o Cost of oil, commodities and other raw materials are rising and causing firms to push costs through into prices
o The value of the dollar is declining raising the price of imported intermediate goods and raw materials.
o Workers and other suppliers expect the economy to improve or inflation to rise so they are asking for higher wages/prices
o Productivity of workers is decreasing causing the cost of output to rise
o Recent legislation is adding costs to business firms
THAT’S A LOT OF STUFF! So let’s focus. We can argue about each or every item on those lists after I post this to the blog site. Let’s focus on one well-known proxy for these factors impacting the demands and supply for goods and services – Capacity Utilization (Cap U). Cap U reflects how intensively firms are using their factories and businesses. When Cap U is high, we think of a factor humming with lots of activity. Lots of shifts are being worked. Some workers are doing overtime. Orders are flying out the doors and trucks are running nice people like us off the road as they hurry to deliver new goods to Best Buy and LaTorre Mexican Restaurant. But when Cap U is low – imagine the cleaning crew whistling as they spend hours dusting off idle machines and slow-moving workers. Not much is going on. Machines and workers are idle.
The below graph of Cap U was taken from the St. Louis Fed. I would point out a few things. First, it is very cyclical. The grey bars show the dates of seven recessions since 1970. In every recession Cap U declined. Look at how much it declined in the 1975 recession. Look at how much it fell between 1980 and 1982. In the recent recession it fell too – as one might expect. Thus, there are disinflationary forces at work in EVERY recession.
Second, notice that the Cap U rate in the latest recession is the lowest of all! While this is true, it is also true that the CHANGE in the Cap U rate has been large but not unprecedented. The rate is low in 2010 because there is a long-term downward trend clearly exhibited in the Cap U. So the meaning of the historically low Cap U is ambiguous with respect to future changes in the inflation rate.
Third, notice that once a recession is over, the Cap U can very quickly return to past higher rates. While it might take a few years to return to previous peak rates – it takes less time to return to normal productive capacity. Normal productive capacity DOES NOT signal future disinflation or deflation.
There is much concern about the weak US economy. No one knows how long the US will remain in recession with low Cap U rates and disinflation. Much depends on that long list of supply and demand factors above. Our US leaders have expressed a strong preference to gamble with inflation by emphasizing the weakness in the economy. I say gamble because we are closer than we think to an increase in Cap U and the latter means that an increase in inflation might be around the corner. But notice that there are many countries who have taken the opposite tack. That is, they prefer not to gamble with inflation. Germany, Canada, and others have weak economic growth too, yet they prefer to err on the side of less stimulus. Their preference is not without some support as I have tried to show here. I would also point out that both Canadian and German beers are excellent.
Sorry but the graph below won't display completely because of my imperfect cut and paste skills! To fee the full graph try this link:
http://research.stlouisfed.org/fred2/graph/?s[1][id]=TCU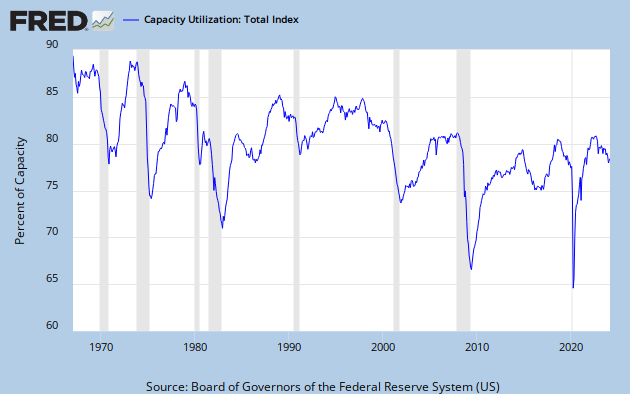
Larry,.,. It looks to me like we have a long way to go in capacity utilization. The real issue is, however. not deflation (although its consequences would be severe) but how much pain do we need to ask our unemployed (who were not the cause of this mess), not to mention the rest of us, to put up with so we can have a short run budget balance improvement and keep the Kato Institute and Rush Limabaugh haoppy. The social and cultural externalities of such a lack of concern abd action are unpredictable but real and possibly dangerous..
ReplyDeleteChuck
Chuck, that's "Cato" Institute, "Limbaugh," and "happy." Otherwise, say what?
ReplyDeleteHi Charlie,
ReplyDeleteI know you mean well and hopefully you are joking about Limbaugh and Cato -- those of us who have a different view from you CARE as much about the unemployed and the economy as you do. We do not have a strange attachment to budget balance as a way to injure the economy. Much has been written lately (e.g David Brooks, New York Times)with serious reservations about additional stimulus -- implying that it will NOT help the unemployed or the economy. Much has been written that explains why budget balance --or at least some movement toward it -- is necessary to move the economy towards full employment. People on both sides have proper concerns. They just have different opinions about how you attain the goals. In my post, I tried to lay out some reasons for why we should not underestimate a return of inflation and why we should be dubious about forecasts of deflation. A return of inflation would be a horrible thing for the unemployed.
Well I agree that inflation is a horrible thing for the unemployed, and employed as well. I will have more to say about this later, just wondering if I can post images?
ReplyDeletehttp://upload.pbase.com/tommy2guns/image/126381473/original.jpg
http://upload.pbase.com/tommy2guns/image/126381473/small.jpg
Mike,
ReplyDeleteI don't think you can post images -- I can't open the links you posted. What are they? Maybe I could post them if you sent the files to me.